建立一個觀測與數值模式框架探索台灣山地雲霧森林的生態水文氣候系統:以棲蘭山區為例
Establish an observational and numerical model framework to explore the eco-hydro-climatic system of cloud forests in Taiwan’s mountains: taking Chi-Lan Mountain as an example
羅敏輝
1, *、莊振義
2, *、黃倬英
2
1) 大氣科學系
2) 地理環境資源學系
*) 氣候變遷與永續發展國際學位學程合聘教師
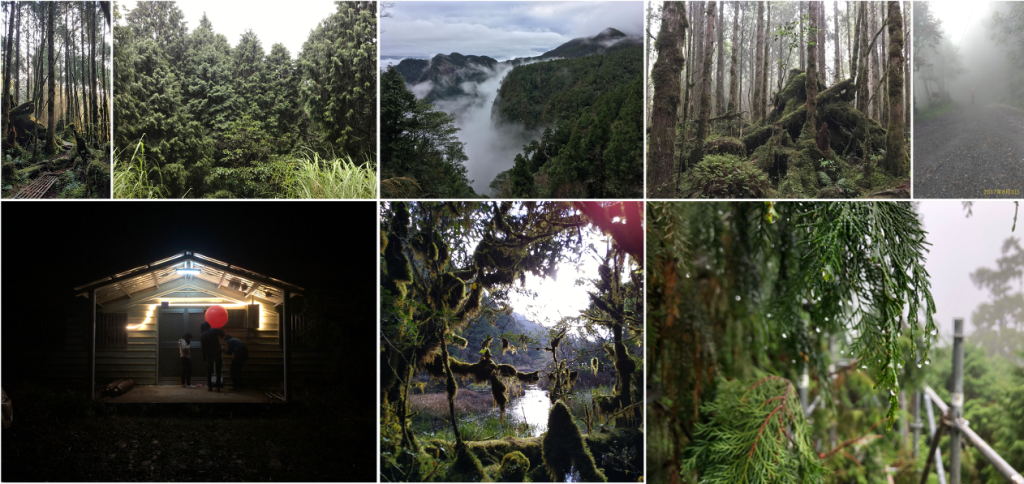
Montane Cloud Forests (MCFs) are defined as forests situated on mountainous terrain with constant immersion in low clouds and fogs. It features low light, high humidity, and a wide range of the eco-hydro-climatological system. MCFs can alter the water and energy supply by intercepting cloud/fog and provide unique ecosystem services. Critical economic crops, such as tea and coffee, usually exist over the fog-cloud-forest regions; thus, MCFs have ecological and economic importance. However, since climate change and land-use changes may directly affect the water, energy, and carbon cycles as well as the cloud and fog conditions, a grand challenge research area in the MCFs is the complex interactions among the ecology, hydrology, and climate as well as the vulnerability of the ecosystem, especially under a changing climate. This project is the first attempt to evaluate fog formation and its impacts on the earth system under climate change through direct measurements and numerical model simulations. Chi-Lan forest, located in the northeast of Taiwan (Figure 1) will be the target in this project and there are three objectives in this project:
A. A novel metric, the fog event index (FEI), to precisely monitor the spatiotemporal dynamics of fog, is developed
B. The characteristics of the asymmetric evapotranspiration comprises the montane's unique hydro-climatological cycle
C. Surface energy fluxes and energy balance closure; establishing the relationship between the cloud-water interception and the environmental factors
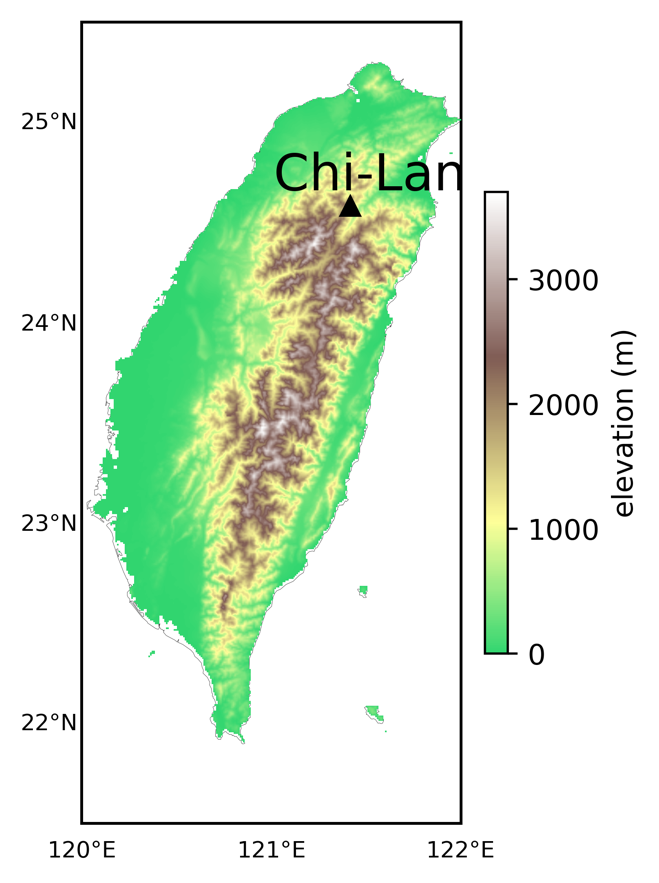
Figure 1. The locations of the Chi-Lan (CL) montane cloud forest.
A. We developed a novel metric, the fog event index (FEI), to precisely monitor the spatiotemporal dynamics of fog. Moreover, we installed four time-lapse cameras in our open-sky meteorological stations, which take photographs every 10 minutes. These data have been utilized to assess the performance of FEI. We have also compiled a Chi-Lan Mountain international research database that documents the studies published in English (please see https://sites.google.com/site/choyhuang/index/chili). This may facilitate international collaboration to inform foreign scholars about the research that has been conducted and the background knowledge that is available in Chi-Lan Mountain.
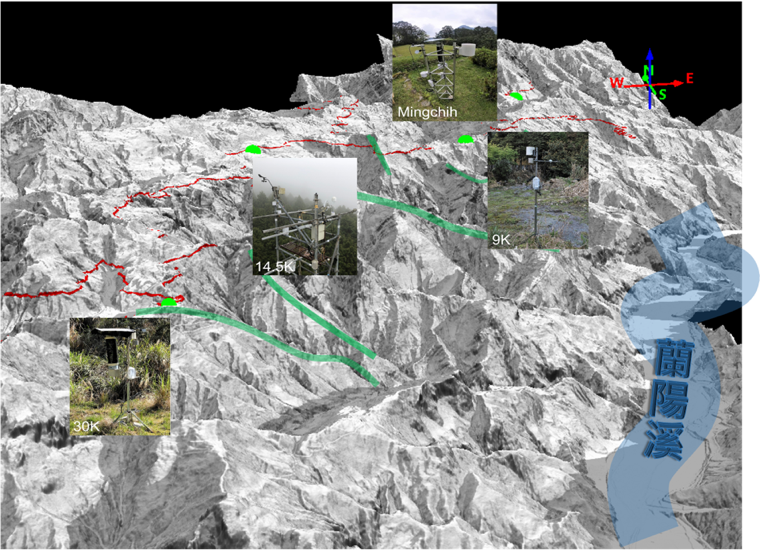
Figure 2. The locations for the fog detection instruments in Chi-Lan.
B. We also utilized the datasets in Chi-Lan's flux tower and focused on the heat fluxes' diurnal variations. The early peak of latent heat flux at Chi-Lan may result in a slower increase in near-surface temperature. The small diurnal temperature ranges plus water vapor accumulation from valley wind and local evapotranspiration make the air frequently saturated at about 3 p.m., thus favoring fog formation. Then, the canopy can intercept fog water in the afternoon. The wetness of the canopy surface is allowed to sustain throughout the night due to high relative humidity; then, the canopy surface water evaporates the next morning. We further utilized the land surface model to demonstrate canopy water's critical role in regulating latent heat flux. Modeling results reveal that canopy evaporation dominates the latent heat flux in Chi-Lan due to the abundant canopy water. In summary, the characteristics of the asymmetric latent heat flux, small diurnal temperature range, frequent fog occurrence, and sufficient canopy water comprise the montane's unique hydro-climatological cycle cloud-fog forest as summarized in the schematic plot of Figure 3.
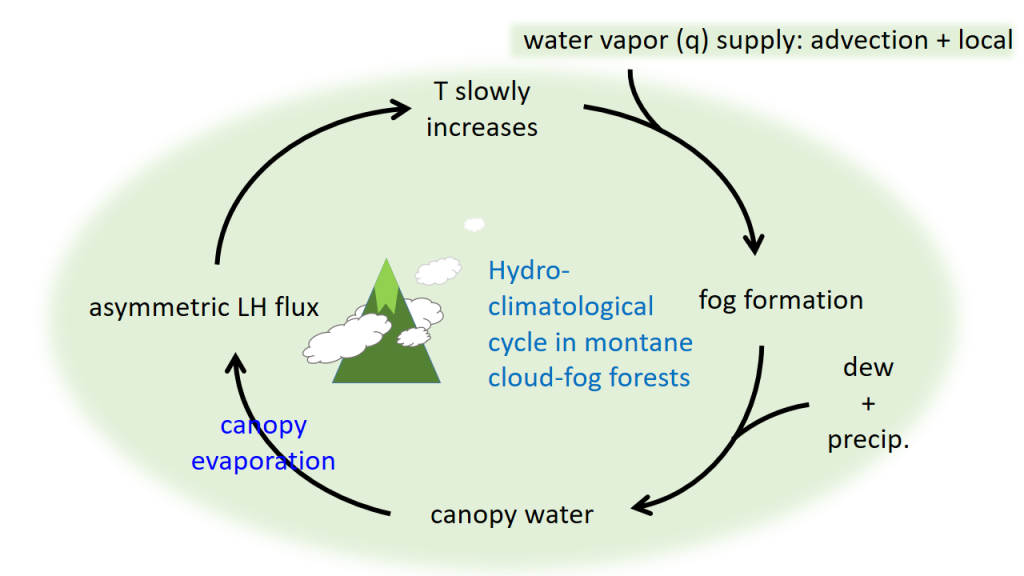
Figure 3. Schematic plot of the hydro-climatological cycle in Chi-Lan Montane cloud-fog forest.
C. The temporal variation of the energy components directly reflects the occurrence of fog formation in the Chi-Lan area. The peak of the LE is relatively earlier than the peak of net radiation and sensible heat flux. The dews formed in the canopy volume in the early morning start to massively evaporate after the sunrise, therefore increase the latent flux quickly in the early morning Energy Balance Closure (EBC) pattern in Chi-Lan is highly correlated with the fog events. The upslope wind field brings the air parcel with different moisture content in the afternoon breakdown the homogenous assumption and further affects the pattern of EBC.
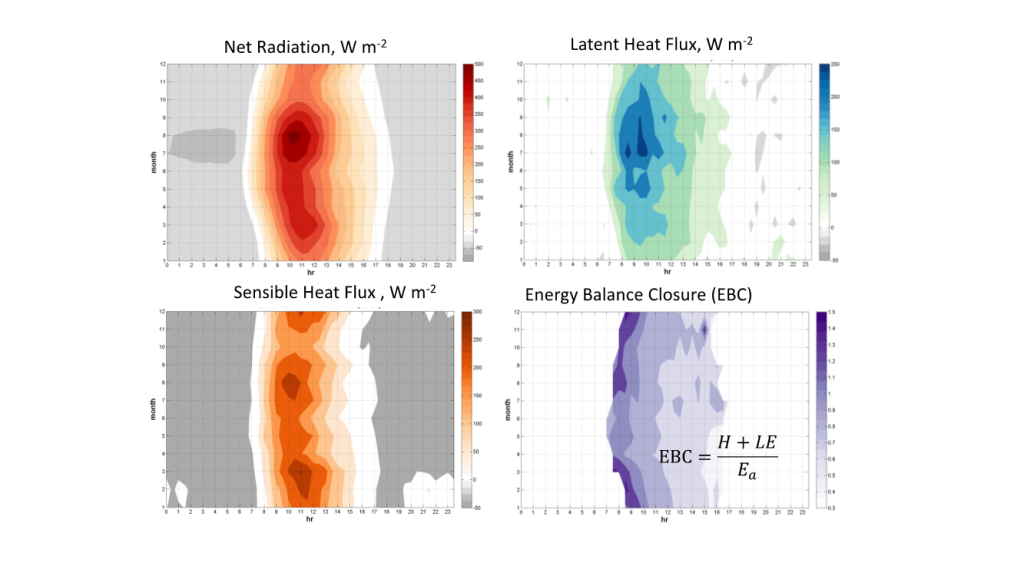
Figure 4. Diurnal and seasonal variation of the surface fluxes (net radiation, latent heat flux, and sensible hear fluxes) and the energy balance closure (EBC) in the Chi-Lan site.
The montane cloud forest ecosystem is very productive globally even though its spatial distribution is in very limited regions in the mountain area of tropical and subtropical regions. However, the amount of cloud-water interception by the cloud forest canopy structure and its effect on the flux patterns remains a big issue for researchers to quantify such an ecosystem's physical and ecological environment. In this study, in order to quantify how the occurrence and formation of upslope cloud/fog affect the cloud-water interception, vertical radiative profiles, and flux patterns inside the canopy volume of the subtropical montane cloud forest, A series of field experiments and mathematical analysis is conducted by using the flux measurement data in Chi-Lan Mountain Flux Site in northeastern Taiwan. This study proposes quantifying the amount of cloud-water interception collected by the canopy volume and establishing the relationship between the cloud-water interception and the environmental factors (temperature, humidity, and wind components). This project is also trying to analyze the allocation and dynamics of radiative components (direct beam and diffuse radiation) throughout the canopy volume under the influences of upslope cloud/fog and quantify the seasonal dynamics over different meteorological and environmental conditions.
In Chi-Lan, a series of experiments were established to measure how much the canopy volume intercepts water during the upslope fog events. The conceptual diagram for the experimental setting is shown in Figure 5, in which the upslope air parcel moves along the topography with the wind speed
u and the temperature of the air parcel drops adiabatically. Once the temperature reaches the dew point, the water vapor inside the moving air parcel is continuously condensing into cloud/fog water if the condensation nuclei exist. When this air parcel moves over a forest canopy, some portion of the condensed water (cloud/fog water) will be intercepted by the canopy structure (leaves, branches, and stems). Meanwhile, the air parcel keeps moving upward along the slope and condenses more water due to the adiabatic cooling. Suppose the wind speed
u, air temperature
T, and specific humidity
q at different locations (towers #1 and #2 in the figure) are given. In that case, the total amount of fog-water interception by the canopy structure between tower #1 and tower #2 could then be estimated. To verify the calculated fog-water interception, this study proposes installing the environmental and eddy-covariance (EC) system on both towers in Chi-Lan Mountain Flux Site to collect the environmental data (
T,
q, and
u). The fog-water interception estimated from the measurement could be compared with other water budget methods or direct ecological measurement. This research is expected to provide the knowledge background and quantitative data to understand the water cycles, energy budget, and flux patterns in low-latitude mountain cloud forest ecosystem from watershed to regional scales.
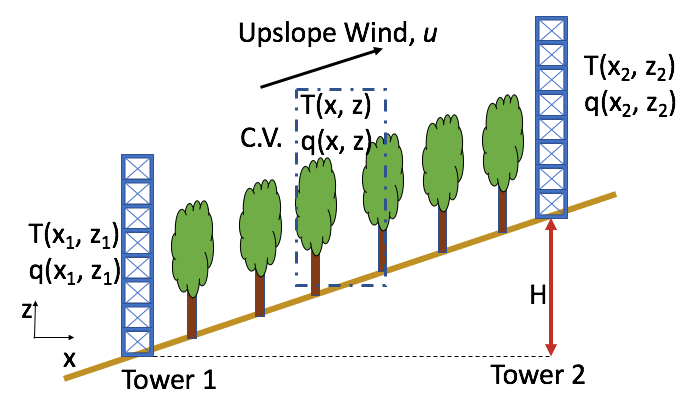
Figure 5. A conceptual diagram of the experimental setting and mathematical analysis for the fog-water interception. (T is air temperature, q is specific humidity. Both T and q are a function of location x and z. C.V. means the “control volume” for experiment and calculation)